मूल कारण विश्लेषण के लिए 3 शक्तिशाली उपकरण (आरसीए)
Next to defining a problem accurately, root cause analysis is one of the most important elements of problem-solving in quality management. That’s because if you’re not aiming at the right target, you’ll never be able to eliminate the real problem that’s hurting quality.
So which type of root cause analysis tool is the best one to use? Manufacturers have a range of methods at their fingertips, each of which is appropriate for different situations. Below we discuss five common root cause analysis tools, including:
 Click Here to Join the Over 790 Students Taking our Highly Rated Courses on Quality Assurance/Quality Control, Lean Six Sigma, Lean Manufacturing, Six Sigma, ISO 9001, ISO 14001, ISO 22000, ISO 45001, FSSC 22000, Product Development etc. on UDEMY.
Pareto Chart
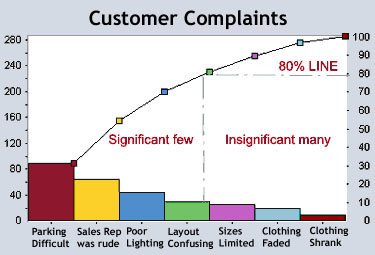
Pareto chart is a graphical tool operating on the principle that 80% of problems can be traced to 20% of the causes of the problem. It is a powerful quality and decision-making tool.
It is a bar graph with lengths of the bars representing frequency or cost (time or money), arranged with longest bars on the left and the shortest to the right, thus visually depicting which situations are more significant and requires urgent attention.
The graph helps to prioritize issues according to their importance. The tool identifies the problem areas or tasks with the biggest payoff. It has several benefits, which include the following:
- Identifying and prioritizing issues and tasks.
- It helps people organize their workloads more effectively.
- It improves productivity.
- It improves business profitability.
Example of a Pareto Chart
 Click Here to Download Readymade Editable Tools & Templates on Quality Assurance/Quality Control, RCA, Lean Six Sigma, Lean Manufacturing, Six Sigma, ISO 9001, ISO 14001, ISO 22000, ISO 45001, FSSC 22000, HSSE, Project Management etc.
Fishbone Diagram
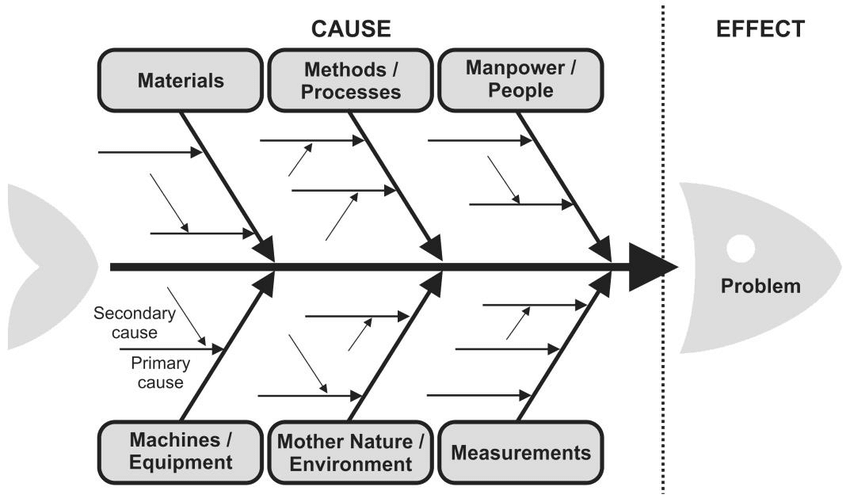
A fishbone diagram is a structured, visual approach for brainstorming or analysing the cause and effect of an issue. They are termed fishbone diagram, because they look like the skeleton of a fish. This technique was developed by Professor Ishikawa in the 1960s.
It is otherwise called the ‘’cause & effect analysis’’. In this case, the problem or effect is displayed at the head or mouth of the fish-like diagram. This cause analysis tool is considered one of the seven basic quality tools. This tool is used for identifying many possible causes for an effect or problem.
To solve a problem with this technique, follow these simple steps below:
- First, write down the problem in a box on the left-hand side of a piece of paper.
- Second, draw a straight line from the box to the other side of the paper.
- Draw several lines that extend out from your long horizontal line. These lines will enable you brainstorm all of the factors that could contribute to this problem. These factors can be into the 4Ms (man, machine, method & materials).
Example of a fishbone diagram
 Click Here to Download Readymade Editable Toolkits & Templates on Quality Assurance/Quality Control, RCA, Lean Six Sigma, Lean Manufacturing, Six Sigma, ISO 9001, ISO 14001, ISO 22000, ISO 45001, FSSC 22000, HSSE, Project Management etc.
5 Whys
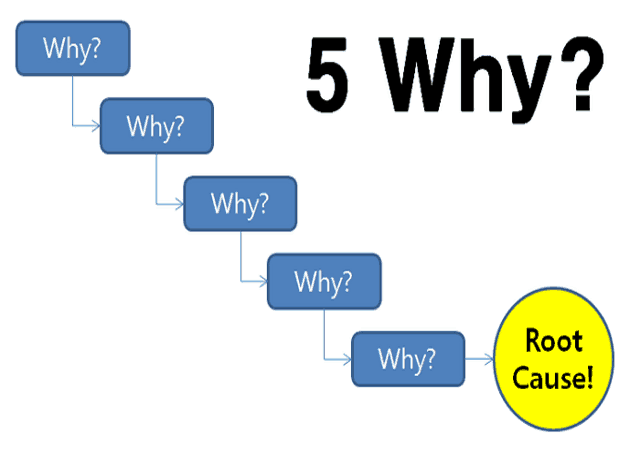
The 5 Whys method is part of the Toyota Production System, developed by Sakichi Toyoda, a Japanese inventor and industrialist. The goal of this technique is to determine the root cause of a defect or a problem by successively asking the question “Why?” until the root cause of the problem is discovered.
It is a problem-solving method that explores the underlying cause-and-effect of particular problems, sieving out all symptoms.
When applying the 5 Whys technique, the intent would be to get to the problem's essence, that is, the ‘real’ cause of the problem and then fix it. The application of the 5 Whys may show you that the source of the problem is quite unexpected.
Example of 5 Whys
 Click Here to Download Readymade Editable Toolkits & Templates on Quality Assurance/Quality Control, RCA, Lean Six Sigma, Lean Manufacturing, Six Sigma, ISO 9001, ISO 14001, ISO 22000, ISO 45001, FSSC 22000, HSSE, Project Management etc.
About the Author
Adebayo is a thought leader in continuous process improvement and manufacturing excellence. He is a Certified Six Sigma Master Black Belt (CSSMBB), Digital Manufacturing Professional and ISO Management Systems Lead Auditor (ISO 9001, 45001 & ISO 22000) with strong experience leading various continuous improvement initiative in top manufacturing organizations.
You can reach him here.


